线程饥饿
2007年3月5日
在运行几次基准测试时,我发现 http_load 在某些连接上出现超时。这种情况在所有 Web 服务器以及 lighttpd 中的不同后端都出现过。
在修补 http_load 以正确处理 timed out 和 byte count 错误后,我能够轻松地将超时与其他问题区分开来。在最近的一个变更集中,我添加了一个基础设施来跟踪 lighttpd 中单个连接所花费的时间,包括在 gthread-aio 后端的不同阶段所花费的时间
- 调度线程化读取(threaded-read())
- 在线程中启动读取(read())
- 等待其完成
- 将结果发送到主循环
- 将缓冲数据写入套接字
您可以通过设置定义 LOG_TIMING 来启用此计时。
network_gthread_aio.c.78: (trace) write-start: 1173101341.237616 read-queue-wait: 680 ms read-time: 0 ms write-time: 21 ms
network_gthread_aio.c.78: (trace) write-start: 1173101341.229014 read-queue-wait: 576 ms read-time: 0 ms write-time: 134 ms
network_gthread_aio.c.78: (trace) write-start: 1173101341.240815 read-queue-wait: 681 ms read-time: 6 ms write-time: 19 ms
我编写了一个脚本,从错误日志中提取这些计时数据,并使用 gnuplot 将其转换为图像。
#!/bin/sh

## parse the errorlog for the lines from the timing_print
## - extract the numbers
## - sort it by start-time
## - make all timestamps relative to the first start-time

cat benchmark.error.log | \
    grep "network_gthread_aio.c.78:" | \
    awk '{ print $4,$6,$9,$12 }'  | \
    sort -n | \
    perl -ne '@e=split / /;if (!$start) { $start = $e[0]; } $e[0] = $e[0] - $start; print join " ", @e; ' > $1.data

cat <<EOF
set autoscale
set terminal png
set xlabel "start-time of a request"
set ylabel "ms per request"
set yrange [0:30000]

set title "$1"
set output "$1.png"
plot \
"$1.data" using 1:2 title "read-queue-wait-time" with points ps 0.2, \
"$1.data" using 1:(\$2 + \$3) title "read-time" with points ps 0.2, \
"$1.data" using 1:(\$2 + \$3 + \$4) title "write-time" with dots

set title "$1 (read-queue-wait)"
set output "$1-read-queue-wait.png"
plot \
"$1.data" using 1:2 title "read-queue-wait-time" with points ps 0.8

set title "$1 (read)"
set output "$1-read.png"
plot \
"$1.data" using 1:3 title "read-time" with points ps 0.8 pt 2

set title "$1 (write)"
set output "$1-write.png"
plot \
"$1.data" using 1:4 title "write-wait-time" with points ps 0.8 pt 3

EOF
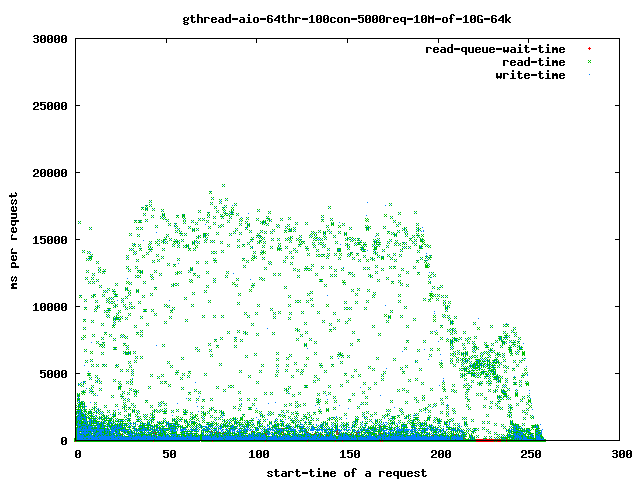
第一个基准测试花费了
./http_load -parallel 100 -fetches 500 ./http-load.10M.urls-10G
和
server.max-read-threads = 64
## compiled with 64k read-ahead
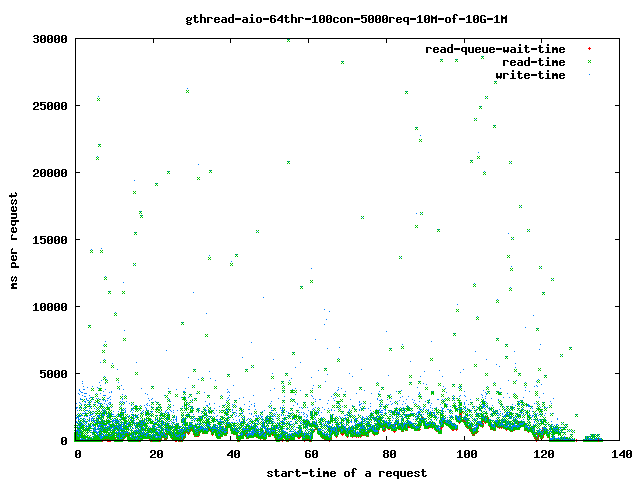
从磁盘read()数据所花费的时间增加
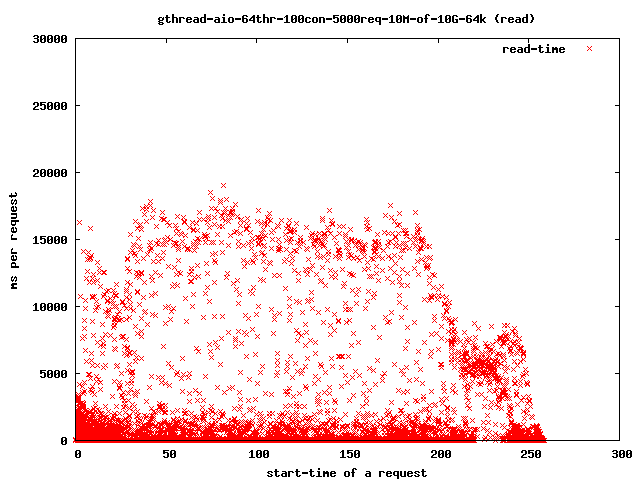
更详细
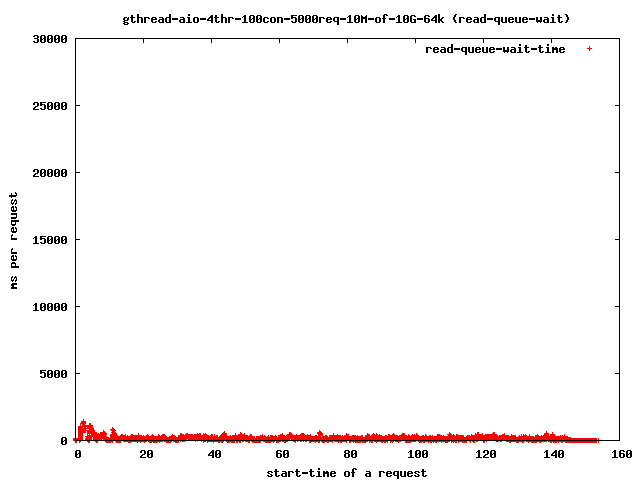
如果您将线程数减少到 4,您将得到
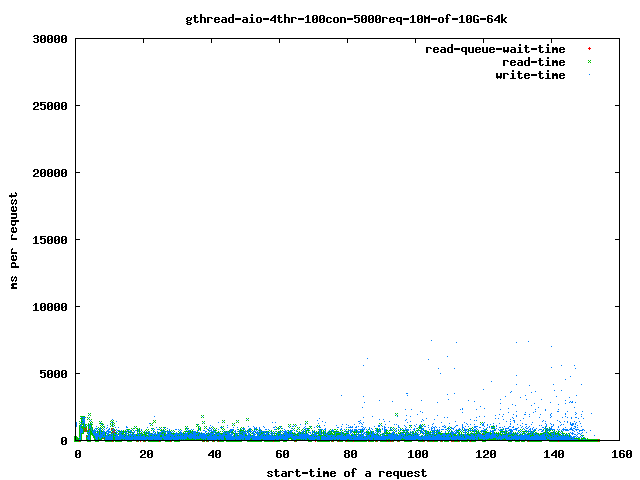
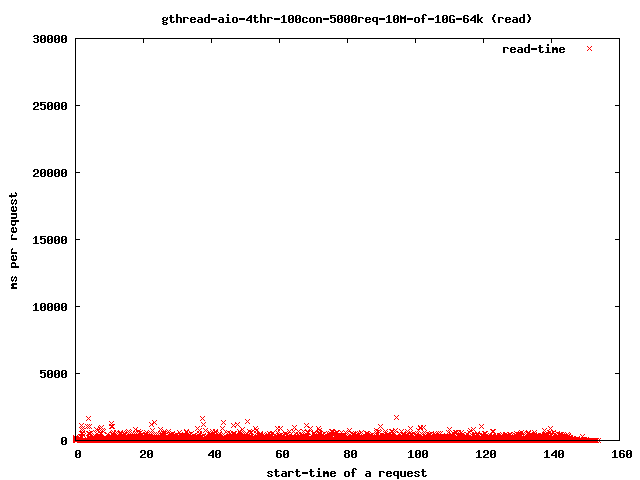
并且读取时间降至
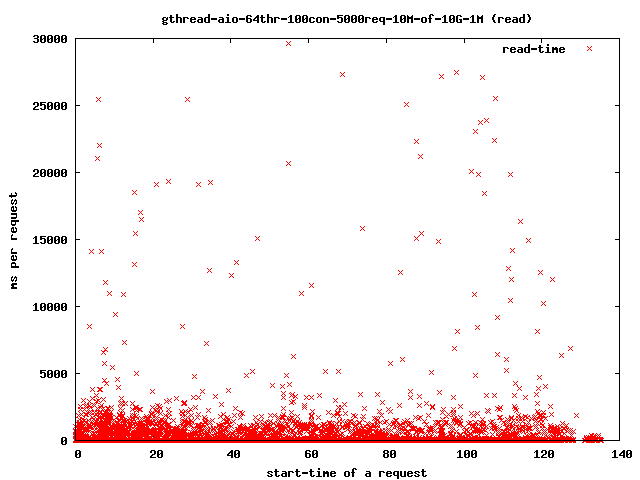
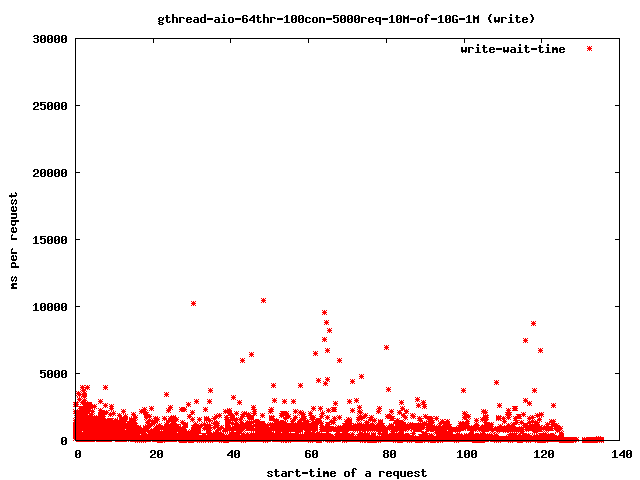
对于我们的超时,只有那些超出 4 秒范围的点才值得关注,因为它们是我们的饥饿 read() 线程。如果它们花费太长时间才能完成,客户端将关闭连接,用户将得到一个损坏的传输。
如上图所示,减少线程数有助于限制问题的影响。
threads-runnable = threads-started - threads-blocked
随着越来越多的线程陷入停滞,能够运行的线程越来越少,一个停滞的线程再次获得 CPU 时间的可能性正在增加。在最坏的情况下,所有可用线程都在等待,并且至少有一个会完成。
更多图表
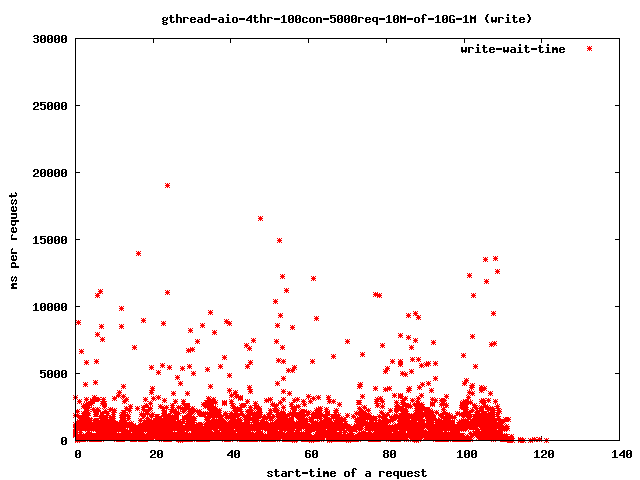
- 4 个读取线程,10MB 文件,64KB 预读
- 全部
- 读取队列等待
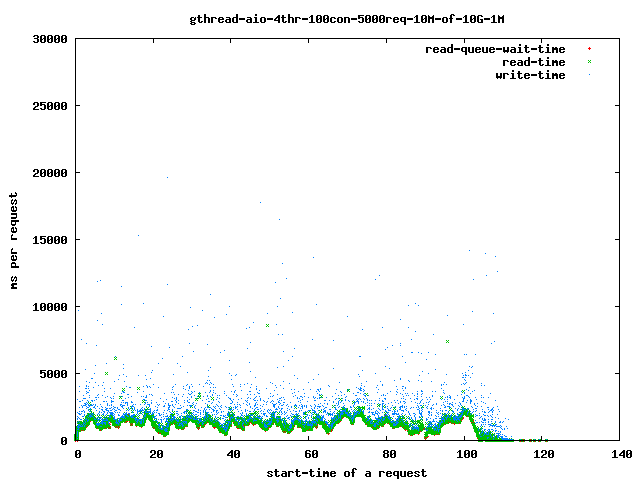
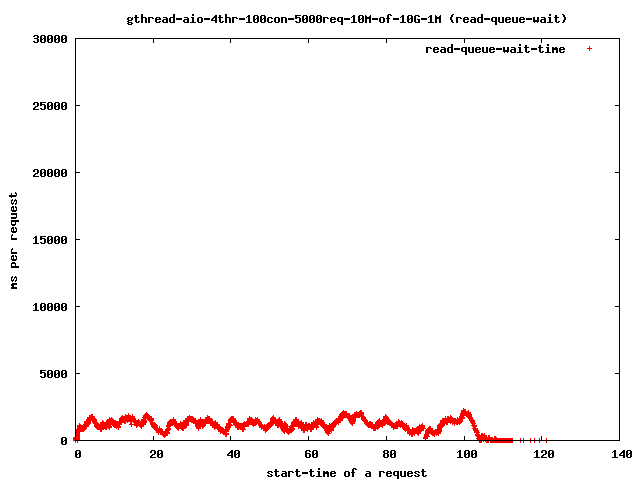
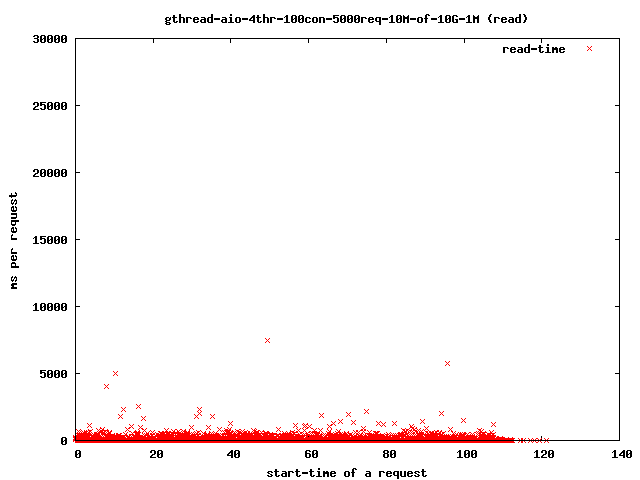
- 4 个读取线程,10MB 文件,1MB 预读
- 全部
- 读取队列等待
- 读取
- 写入
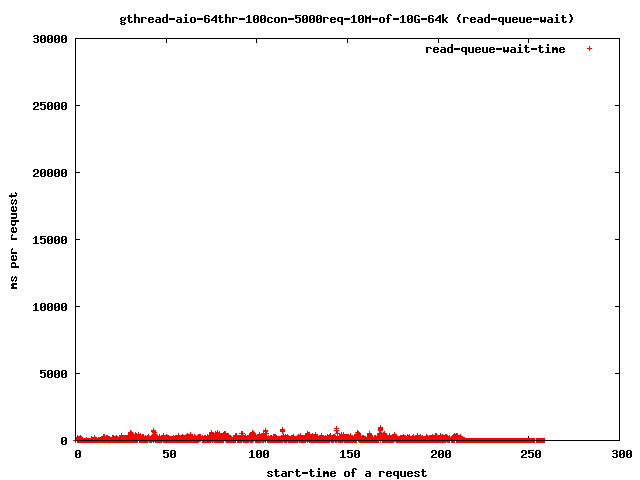
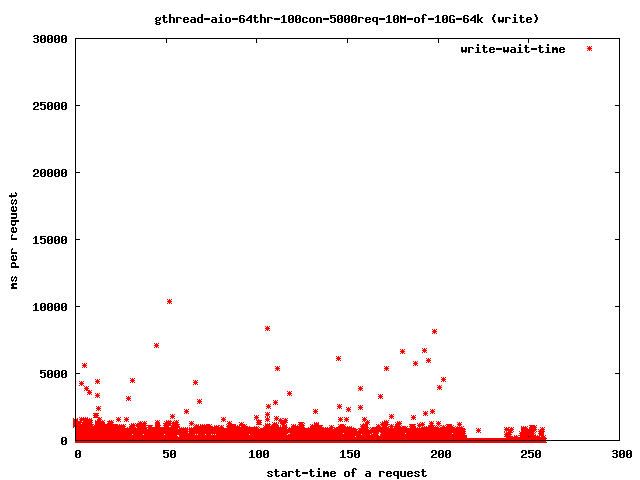
- 64 个读取线程,10MB 文件,64KB 预读
- 全部
- 读取队列等待
- 读取
- 写入
- 64 个读取线程,10MB 文件,1MB 预读
- 全部
- 读取
- 写入
经验法则
将最大线程数保持在磁盘数量的两倍。